Glossary
At Phocas we are all about making data accessible to all, so don't fret, we have your back and have collated an A to Z of Business planning and analytics terminology. This simple guide is also a reminder of how easy it is to use our BI software.
Everyone needs data to carry-out their work better. This guide is to ensure you don't trip up in sales meetings or briefing documents. You should not hesitate to ask what something means as often different people use phrases and words interchangeably which can make things confusing.
A
Ad hoc analysis
Ad hoc query
One-off, “on demand” reports that can be easily created within BI software and quickly answers a specific business question that has arisen unexpectedly.
Advanced analytics search
Aggregate data
Formed or calculated by the combination of many separate units or items. For example, it’s a big part of financial analysis and often finance people use a platform to collate internal and external market to make recommendations and predictions about the company’s financial future.
Agile analytics
Analytics
The systematic computational analysis of data or statistics. Phocas data analytics lets you dig into a consolidated view of your actual product, customer and financial data.
Analytics as a service
Application Programming Interface (API)
Computer code that allows two software programs to communicate with each other.
Automated business alert
B
Balanced scorecard
A performance management tool that holistically captures an organization’s performance from several vantage points (e.g. sales results vs. inventory levels) on a single page.
Behavioural analytics
Using data about people’s behaviour to understand intent and predict future actions.
BI reporting
Big data
Extremely large data sets that may be analysed computationally to reveal patterns, trends, and associations, especially relating to human behaviour and interactions.
Business intelligence (BI)
A technology-driven process for analyzing data and presenting actionable information to help executives, business managers and purchasing managers make more informed business decisions.
Business process modeling
C
Cash flow forecasting
Commingled data
Commingled data refers to multiple data sources including financial, operational, sales, HR, CRM consolidated into one single dataset.
Contextual data
A structuring of big data that attaches situational contexts to single elements of big data to enrich them with business meaning.
Customer Relationship Management (CRM)
Denoting strategies and software that enable a company to organize and optimize its customer relations.
D
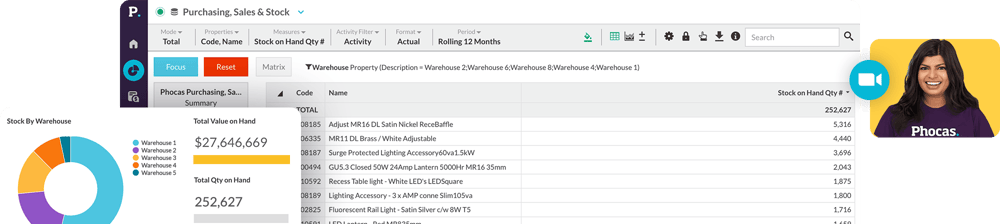
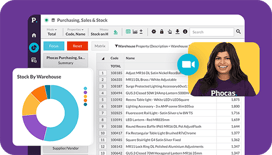
Dashboard
A graphical summary of various pieces of important information, typically used to give an overview of a business. Phocas dashboards allow you to see at a glance how your business is performing with an option to go deeper into the underlying data sitting behind the dashboard.
Data analytics
Data analysis is the process of inspecting, cleansing, transforming, and modelling data to uncover actionable intelligence. It’s a key process in business intelligence.
Data blending
Data cataloguing
Data cleansing
Data cube
Data discovery
Data exploration
Data export
Data hierarchy
Data intelligence
Data mapping
Data mart
Data maturity
Data model
Data modeling
Data organization
Data product
Data quality
Data reporting
Data Source Name (DSN)
A data structure than contains the information about a specific database that an Open Database Connectivity (ODBC) driver needs in order to connect to it.
Data standardization
Data standardization is the process of establishing and applying rules and guidelines to ensure that data points are uniformly represented.
Data visualization
Data warehouse
A large store of data accumulated from a wide range of sources within a company and used to guide management decisions.
Data wrangling
Database
A structured collection of facts and statistics set of data held in a computer, especially one that is accessible in various ways.
Database query
Diagnostic analytics
Drill-down
E
Embedded reporting
Enterprise Resource Planning (ERP)
An enterprise resource management system which manages information and resources involved in a company’s operations.
Entity-Relationship Diagram (ERD)
Extract, Transform, Load (ETL)
Three separate functions combined into a single programming tool. First, the extract function reads data from a specified source database and extracts a desired subset of data. Next, the transform function works with the acquired data – using rules or lookup tables, or creating combinations with other data – to convert it to the desired state. Finally, the load function is used to write the resulting data (either all of the subset or just the changes) to a target database, which may or may not previously exist.
F
Finance data management
Financial Forecasting
A prediction or estimate of future events.
Financial planning and analysis (FP&A)
Financial planning and analysis (FP&A) is a combination of financial activities that support an organization's financial health: planning and budgeting, reporting, and forecasting and modeling. FP&A solutions enhance the finance department's ability to manage performance by linking corporate strategy to execution.
G
Gap analysis
Geospatial analysis
I
Integrated analytics
Interactive dashboard
An easy digital dashboard of key metrics that is easy to filter, edit and explore to focus on the data that is most important to your team and company.
Interactive visualization
Technology enables the exploration of data via the manipulation of chart images, with the color, brightness, size, shape and motion of visual objects representing aspects of the dataset being analysed. These products provide an array of visualization options that go beyond those of pie, bar and line charts, including heat and tree maps, geographic maps, scatter plots and other special-purpose visuals.
Inventory
J
Joint Application Development (JAD)
Is a methodology that involves the client or end user in the design and development of an application, through a succession of collaborative workshops called JAD sessions.
K
Key Performance Indicator (KPI)
A quantifiable measure used to evaluate the success of an organization, employee in meeting objectives for performance.
L
Lead generation
The use of a computer program, a database, the Internet, or a specialized service to obtain or receive information for the purpose of expanding the scope of business, increasing sales revenues, looking for a job or for new clients or conducting specialized research.
M
Managed cloud
Management Information System (MIS)
A computerized information-processing system designed to support the activities of company or organizational management.
Massively Parallel Processing (MPP)
Metadata
Metric
A method of measuring something, or the results obtained from this: ‘the report provides various metrics at the class and method level.’
Mobile BI
Software that extends desktop business intelligence applications so they can be used on a mobile device. Phocas is a fully mobile software solution that allows access to your data, dashboards and reports wherever you are on smartphones and tablets.
N
Non-value-adding
Refers to activities within a company or supply chain that do not directly contribute to satisfying end consumers’ requirements. It is useful to think of these as activities that consumers would not be happy to pay for.
O
Online Analytical Processing (OLAP):
Computer processing that enables a user to easily and selectively extract and view data from different points of view.
Online Transaction Processing (OLTP)
A class of software programs capable of supporting transaction-oriented applications on the internet.
Open DataBase Connectivity (ODBC)
Operational reporting
P
Predictive analytics
Prescriptive analytics
R
Real time dashboard
Real time data analytics
Relational Database Management System (RDBMS)
Relational Online Analytical Processing (ROLAP)
Retail analytics
Role-based access control (RBAC)
A method of regulating access to computer or network resources based on the roles of individual users within an enterprise.
S
Self-service reporting
Slice and dice
Snapshot
A brief look or summary. A record of the contents of a storage location or data file at a given time.
Software as a Service (SaaS)
A software distribution model in which applications are hosted by a vendor or service provider and made available to customers over the internet.
Software platform
Sparkline
Structured Query Language (SQL)
An international standard for database manipulation.
Supply Chain Management (SCM)
The oversight of materials, information, and finances as they move in a process from supplier to manufacturer to wholesaler to retailer to consumer.
T
Talent analytics
Technology-enabled relationship management (TERM)
The concept of forming one enterprise-wide view of the customer across all customer contact channels (i.e., sales, marketing, and customer service and support). It is a complex area, requiring complex solutions to problems of integration, data flow, data access and marketing strategy. A critical component is the database that serves as the customer information repository.
V
Visual data analysis
X
xP&A
Understand the past, operate better today, and plan well for the future